CISC181 F2017 Lab2
Preliminaries
This assignment uses the Swing library for basic drawing. You may want to refer to the documentation for the JFrame, JComponent, Graphics, and Color classes, among others. Just like last time:
- Make a new project (but now n = 2) following these instructions.
- Name your class "Lab2". This happens when you are creating a new module, in the Java class name field
Instructions
Modify Lab2.java as follows:
- Add your name and section number in a comment before the Lab2 class body
- Initialize a different JFrame and custom JComponent (as explained in the Sep. 18 lecture slides) for each of the two exercises below
- Here is some example code used in lecture
- Each custom JComponent will have its own paintComponent() method doing something different for each exercise below
- Two JFrames initialized in main() means two windows should pop up each time you run the program
ColorJComponent
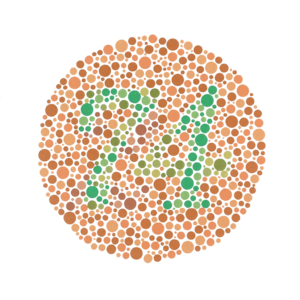
For this exercise you will draw two patterns similar to an Ishihara-style color blindness test. An example of such a test is shown below:
For all randomness, use the Random class as necessary
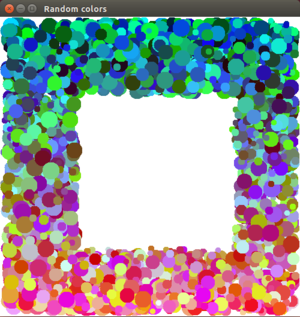
- The window should be initialized to 500 x 500, have the title "Color Test", and be drawn with a white background
- Each circle should be a random diameter from 10-30 pixels
- There should be no more than 5,000 circles
- No circle should be drawn if its upper-left corner lies in the middle 50% of the window (both vertically and horizontally)
- Don't use the 500 value directly, but rather getWidth() and getHeight() for the current values, in case the window is resized
- Every circle should be completely inside the window
- The RGB color of each circle should be set as follows:
- Red component: 0 at the top of the window, 255 at the bottom, and linearly scaled by y coordinate in between
- Green, blue components: Each a different random number in the range [0, 255]
Add your name and section number in a comment before the ColorJComponent class body
GraphJComponent
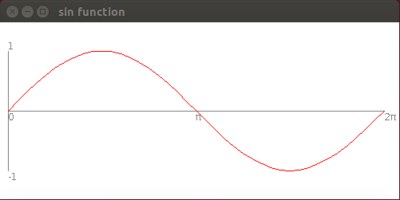
For this exercise you will draw a portion of a graph of the sine function (i.e., Math.sin()).
Your graph should have the following characteristics:
- The window will be 500 x 250, have the title "sin function", and have a white background
- The plot should be scaled to more-or-less fill the window. As with the Feb. 21 discussion in lecture of the grid of squares, remember the difference between pixels and whatever mathematical units (radians, rows/cols, etc.) you are working with!
- Again, don't use the 500 and 250 numbers directly for dimensions, but rather getWidth() and getHeight() in case the window is resized
- The plot covers the range from 0 to 2π radians
- Draw the curve in red as a series of connected line segments (use drawLine() in a loop). Make sure to use enough segments that the curve is somewhat smooth.
- Draw a horizontal and vertical axis in gray as shown
- Label the vertical axis with "-1" and "1" where appropriate
- Label the horizontal axis with "0", "π", and "2π" where appropriate. "π" should be drawn as a Greek letter (the Unicode is '\u03c0')
Add your name and section number in a comment before the GraphJComponent class body.
You may add more labels, tick marks, etc. to your plot as desired -- the above represents minimum requirements. A step above and beyond would be adding the cosine function in blue -- but I'm sure you can do more than that.
Finishing up
Remember to use proper naming and formatting style throughout your code, and submit your Lab2.java, ColorJComponent.java, and GraphJComponent.java on Sakai by Monday, September 25


